A decade of cryptocurrencies
It has been almost 11 years since the first official Bitcoin trades in July of 2010. Its price has experienced quite a run. Although controversial, cryptocurrencies have firmly taken hold of the current investing landscape, won hearts and minds of groups of investors, suggesting they are here to stay for longer than many have anticipated. As more data becomes available, it is interesting to check on them from a historical, quantitative and trading perspective.
All data below comes from the extremely useful charting and market data site Stooq, via their cryptocurrency screener and historical data functionality. At the moment [May 2021] there are exactly 110 cryptocurrency data series available, of which I've excluded stablecoins pegged to a specific fiat currency (mostly USD) and one particular coin exhibiting frequent severe price jumps, to arrive at a total of 102 assets. The complete list is accessible here.
The total number of listed cryptocurrencies worldwide is over 5000 assets.[10] It is possible to access historical price data of most of these coins (solving the problems of database bias and survivorship bias), but it is beyond the scope of this short exercise.
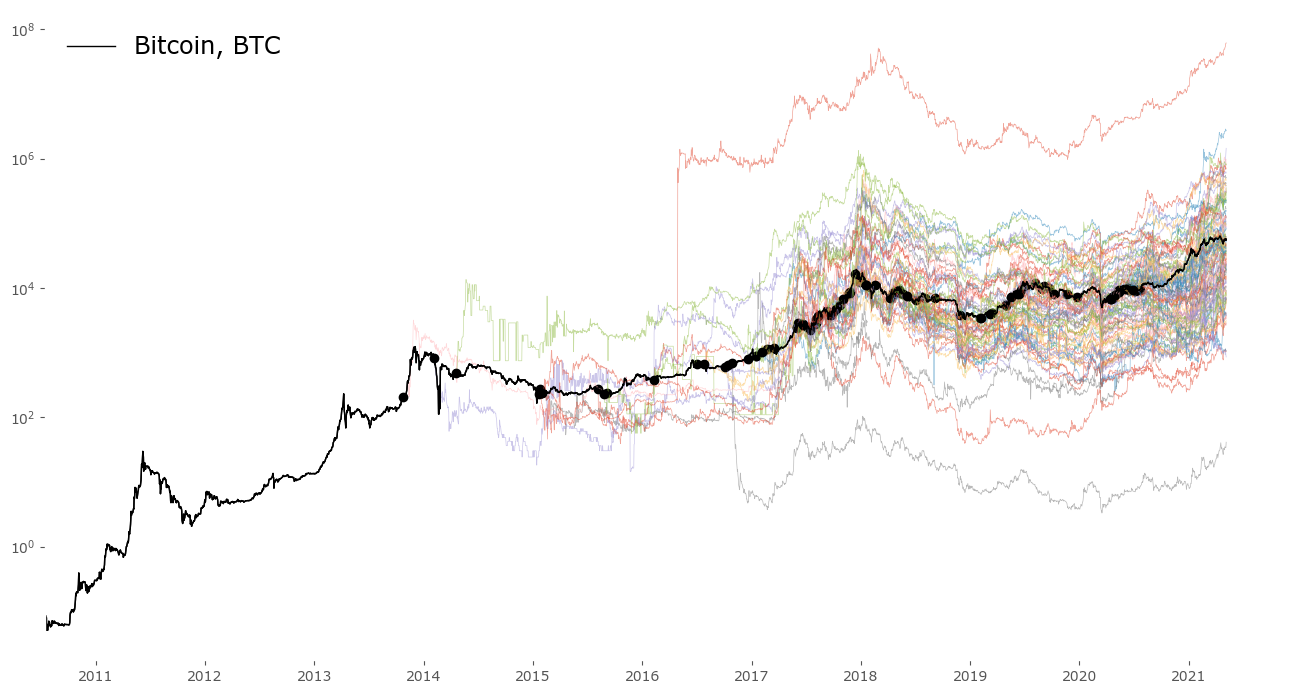
For illustration purposes, the chart below is constructed around Bitcoin (BTC), as this is the first and still most actively traded cryptocurrency.[11] All other coins' prices have been rescaled to start at the exact price point that Bitcoin was on the day of their first trade. This enables convenient comparisons between the coins and BTC. Select any of the cryptocurrencies from the list below, the coins are sorted in order of appearance (date of first available data). Data ends on May 5, 2021.
A very fun feature is sliding along the time axis below the chart, with markers showing the exact time of first data for each coin.
Hover on coin name below or select from list to see specific coin highlighted:

Data from Stooq.com.
A simple moving average strategy
Acknowledging the popularity of cryptocurrencies in recent times, especially among young investors, it is not surprising to see that long term returns among most coins are extremely positive. After all - an asset class is often most popular after a series of good returns. Cryptos are also very volatile. So a question arises: could these colossal returns be improved still - or at least not be watered down too much, while retaining some downside protection - by an algorithmic approach?
One of the simplest ways to improve a passive, buy & hold result, is what can be summed up as a simple Moving Average (MA) strategy. The advantage of such a strategy is not market timing; it will not time the market perfectly. To the contrary, it will usually react in a delayed manner, buying after some upside momentum has already been observed, and selling long after the price of the asset has peaked. It's main feature is, however, downside protection.
One could sum up the strategy as "don't disturb when the asset is appreciating in price (stay long), but stay out during price depreciations". A broader analysis of the pros and pitfalls of such an approach can be found on the Philosophical Economics article as an intro to a more sophisticated (but related) trading strategy.[12]
For our purposes here it's important to understand that the length of the moving average window is not crucial - this parameter represents a trade-off between faster reaction times (but more false signals, therefore more whipsaws and more trading costs) and higher accuracy (therefore less whipsaws and less frequent trades, but slower reaction times, risking missing some of the important upside/downside movement). For this study I've used the popular choice of a 50-day moving average.
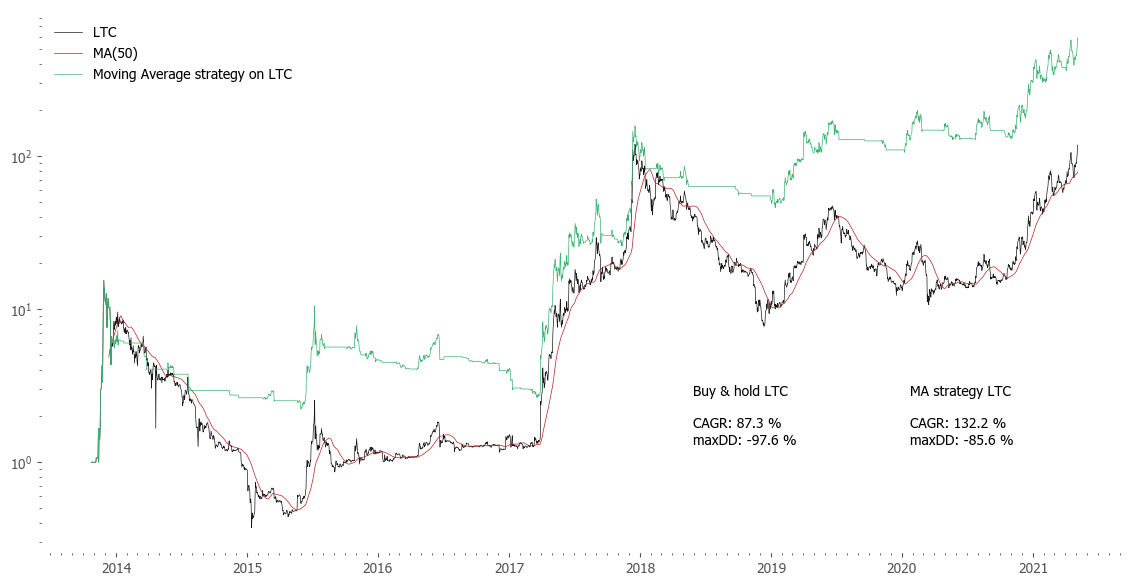
The chart below (Fig. 2) shows an example of such a simple moving average strategy on the Litecoin cryptocurrency data. The black line represents the asset (similar to a passive buy & hold), the green one is a 50-day moving average strategy with a simple binary rule:
Hold asset long when the price is above the MA, stay neutral otherwise.All results below referred to as "Moving Average strategy" or "MA strategy" refer to only this simple procedure.
There are, of course, multiple ways to improve on such a strategy and make the results more appealing, but that's not the point. The objective is to show how just a simple procedure can improve results, without the need of more complex rules. One needs to remember, this exercise is only theoretical and for educational purposes, it is not a complete trading strategy.
First of all because of the high risk of overfitting. By testing out all historical data in-sample, and not performing out-of-sample tests, we're actually producing just an optimized backtest, not a real test of close-to-real-life-as-possible situations.
Secondly, the data selected for the backtest already has inherent survivorship bias, as we backtest here only on coins that still exist. It is reasonable to assume that such a strategy running on real assets in the past would result in at least some of the coins losing all their value completely and ceasing to exist (bankruptcy on some of the capital involved).
Thirdly, it is not at all clear if the coins were actually investable in the past (sufficiently liquid, and at all available to investors at the exchange dates and prices stated in the data). The transaction costs are assumed to be negligible, which surely is not the case, but on the other hand - the number of transactions is fairly low, so the costs in respect to the growth rates in this case might be relatively negligible.
And lastly, these being cryptocurrencies, it's important to remember these are highly volatile and speculative instruments, resulting in extreme fluctuations and multiple high-range drawdowns. Sometimes price spikes in orders of magnitude. As is evident from the maximum drawdown (maxDD) column below almost unilaterally reaching above 90%, often reaching as high as 97%. The CAGR rates reported are also insanely extreme, and it would be overly optimistic to expect such high growth rates from these same instruments going forward (although, of course, not impossible).
For keeping the results at least partly comparable, and the CAGR a bit more realistic, in the following analysis I've included only coins having at least 3 years of data. This period includes a cryptocurrency bear market in the years 2018-2020. Thanks to this, the CAGR and drawdown rates are comparable, as for the younger cryptocurrencies the full extent of possible drawdowns hasn't yet been experienced. That brings the total from all 110 assets available on Stooq, to 56 assets.
Results for individual assets
Selected stats of the cryptocurrencies are presented in Table 1. A qualitative analysis follows.
All data is from start of available cryptocurrency data (earliest Jul 17, 2010 for Bitcoin) to May 5, 2021.
Note: here the data is sorted by Market Value at end of the studied period, May 5th, 2021.
| Coin | Full name | First trade date | CAGR [%] |
maxDD [%] |
MA CAGR [%] |
MA maxDD [%] |
Excess CAGR [%] |
|---|---|---|---|---|---|---|---|
| BTC | Bitcoin | 2010-07-17 | 262.7 | -93.1 | 298.2 | -70.3 | 35.5 |
| ETH | Ethereum | 2015-08-07 | 239.5 | -93.9 | 285.7 | -73.9 | 46.3 |
| BNB | Binance Coin | 2017-09-08 | 483.8 | -80.0 | 596.8 | -57.6 | 113.0 |
| DOGE | Dogecoin | 2016-07-01 | 385.8 | -90.7 | 669.8 | -69.0 | 284.0 |
| XRP | XRP | 2015-01-21 | 108.0 | -95.0 | 206.8 | -92.7 | 98.8 |
| ADA | Cardano | 2017-12-30 | 30.6 | -97.9 | 115.7 | -85.8 | 85.1 |
| BCH | Bitcoin Cash | 2017-08-01 | 36.3 | -97.9 | 92.8 | -86.5 | 56.5 |
| LTC | Litecoin | 2013-10-24 | 87.3 | -97.6 | 132.2 | -85.6 | 45.0 |
| LINK | Chainlink | 2017-09-28 | 333.1 | -87.8 | 230.0 | -71.6 | -103.1 |
| XLM | Stellar | 2017-01-17 | 262.7 | -96.1 | 346.9 | -80.1 | 84.2 |
| THETA | THETA | 2018-01-30 | 231.1 | -85.6 | 213.5 | -71.3 | -17.5 |
| ETC | Ethereum Classic | 2016-07-27 | 133.3 | -91.9 | 246.5 | -72.8 | 113.2 |
| TRX | Tron | 2017-10-10 | 204.6 | -96.8 | 230.8 | -83.5 | 26.2 |
| EOS | EOS | 2017-06-29 | 81.5 | -91.2 | 143.7 | -72.1 | 62.2 |
| NEO | NEO | 2017-08-05 | 72.6 | -97.2 | 86.9 | -82.4 | 14.3 |
| XMR | Monero | 2015-01-29 | 214.0 | -93.0 | 84.5 | -98.3 | -129.5 |
| LUNA | Terra | 2017-01-17 | 316.9 | -99.2 | 271.0 | -98.4 | -45.9 |
| MIOTA | IOTA | 2017-06-13 | 35.6 | -97.9 | 90.4 | -72.6 | 54.9 |
| MKR | Maker | 2017-11-23 | 119.5 | -93.3 | 113.3 | -66.4 | -6.2 |
| DASH | Dash | 2014-04-18 | 147.8 | -97.2 | 34.2 | -99.8 | -113.7 |
| WAVES | Waves | 2017-08-04 | 82.1 | -96.9 | 94.2 | -77.6 | 12.1 |
| XEM | NEM | 2017-06-02 | 13.2 | -98.3 | 76.5 | -75.3 | 63.3 |
| ZEC | Zcash | 2016-10-28 | -47.4 | -99.5 | -41.2 | -99.2 | 6.2 |
| BTG | Bitcoin Gold | 2017-10-24 | 4.9 | -98.8 | 158.8 | -69.9 | 153.9 |
| HOT | Holo | 2018-04-18 | -22.5 | -99.1 | -80.6 | -99.9 | -58.1 |
| DCR | Decred | 2015-09-05 | 268.7 | -93.8 | 89.0 | -94.4 | -179.7 |
| ENJ | Enjin Coin | 2017-11-01 | 277.5 | -95.0 | 288.7 | -82.1 | 11.2 |
| DGB | DigiByte | 2014-02-06 | 89.5 | -97.8 | 112.3 | -96.6 | 22.9 |
| BAT | Basic Attention Token | 2017-06-01 | 69.6 | -88.2 | 106.4 | -75.3 | 36.8 |
| SNX | Synthetix | 2018-04-18 | 251.7 | -95.5 | 362.6 | -82.5 | 110.9 |
| SC | SiaCoin | 2015-08-26 | 235.5 | -98.8 | 597.8 | -73.1 | 362.3 |
| QTUM | Qtum | 2017-11-25 | -1.9 | -98.6 | 113.6 | -72.9 | 115.5 |
| ONT | Ontology | 2018-04-07 | -19.4 | -97.1 | 61.4 | -60.0 | 80.9 |
| ZRX | 0x | 2017-08-11 | 141.9 | -94.2 | 179.7 | -83.9 | 37.8 |
| OMG | OMG Network | 2017-07-14 | 112.7 | -98.3 | 188.9 | -74.3 | 76.2 |
| RVN | Ravencoin | 2018-04-17 | 71.0 | -84.8 | 223.7 | -61.3 | 152.7 |
| ICX | ICON | 2017-09-23 | 140.2 | -99.1 | 456.7 | -79.6 | 316.4 |
| DGD | DigixDAO | 2015-01-29 | 631.7 | -98.1 | 1036.0 | -72.7 | 404.3 |
| ZEN | Horizen | 2017-06-06 | 62.2 | -94.7 | 82.6 | -81.0 | 20.4 |
| NANO | Nano | 2018-05-01 | 9.8 | -95.5 | 8.0 | -85.8 | -1.9 |
| KCS | KuCoin Shares | 2017-12-13 | 168.6 | -98.3 | 432.2 | -80.2 | 263.6 |
| XVG | Verge | 2016-02-10 | 268.3 | -99.2 | 272.8 | -90.7 | 4.5 |
| IOST | IOST | 2018-01-18 | 15.1 | -98.1 | 32.8 | -93.8 | 17.7 |
| REN | Ren | 2018-02-17 | 114.4 | -87.7 | 56.0 | -85.3 | -58.5 |
| LSK | Lisk | 2017-02-22 | 143.6 | -98.8 | 279.2 | -80.0 | 135.6 |
| SNT | Status | 2017-11-22 | 53.8 | -98.8 | 167.9 | -78.3 | 114.1 |
| KNC | Kyber Network | 2017-06-20 | -22.7 | -99.9 | 157.6 | -92.3 | 180.3 |
| REP | Augur | 2016-10-04 | 42.4 | -94.7 | 91.9 | -61.1 | 49.5 |
| BTS | BitShares | 2015-01-26 | 44.8 | -98.5 | 103.2 | -84.5 | 58.5 |
| ARDR | Ardor | 2016-10-13 | 66.9 | -99.0 | 109.1 | -84.9 | 42.3 |
| MCO | MCO | 2016-12-19 | 103.9 | -95.8 | -9.6 | -97.9 | -113.5 |
| KMD | Komodo | 2017-03-16 | 122.8 | -97.7 | 141.3 | -82.2 | 18.5 |
| NMR | Numeraire | 2017-06-23 | 9.6 | -98.0 | -17.6 | -92.0 | -27.2 |
| GNT | Golem | 2017-02-03 | 88.0 | -97.5 | 263.8 | -69.9 | 175.9 |
| MONA | MonaCoin | 2015-02-02 | 93.6 | -97.6 | 229.2 | -67.5 | 135.6 |
| HC | HyperCash | 2018-01-17 | -10.2 | -87.5 | -12.9 | -81.7 | -2.7 |
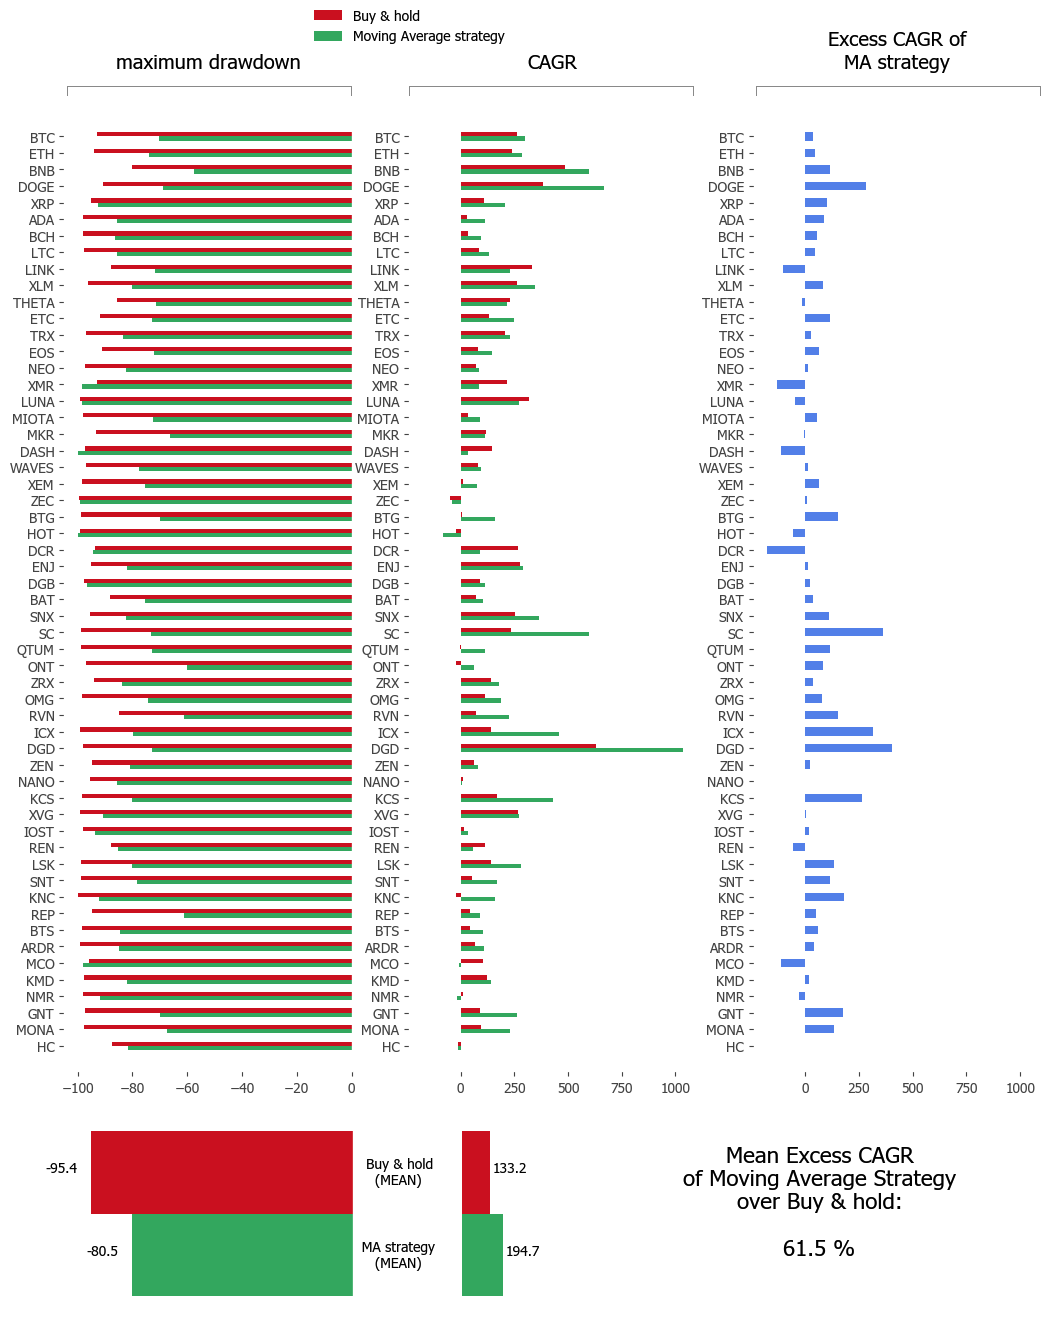
The data from table 1 has been visualized in a graph form below. These are exactly the same numbers, just presented in bars. At the bottom there are arithmetic means for the maximum drawdown, CAGR, and excess CAGR of the moving average strategy compared to passive buy & hold.
Click any cryptocurrency symbol to enlarge. Click again to go back to array.
Conclusions
More than a decade has passed since the first cryptocurrency (bitcoin) trades and transactions have been made. From a toy-idea, to a trillion dollar asset class,[13] cryptocurrencies have flourished in the current tech-savvy, low interest rate environment. Yet they remain the most volatile assets publicly available. It will be very interesting to observe how this asset class develops.
It's interesting that the same simple methodology employed in other asset classes (equities, commodities) has some merit here as well. Of course, the above strategy is just a toy model, plagued with imperfections (risk of overfitting, survivorship bias, high growth rate in the early-adoption phase that would be hard to recreate in future trading environments -- to name a few). But it does show that quantitative (and more importantly: simple) trading strategies have potential even in the relatively young environment of cryptocurrency trading.
Regarding the moving average strategy, the most visible improvement over a passive buy & hold approach is in reducing drawdowns. A mean maximum drawdown of a pure buy & hold strategy is a colossal 95.4% - the reduction to 80.5% might not seem like much, but it's helpful to look at it this way: an asset needs to gain almost 22x (2200%) to undo the loss of a -95.4% drawdown. An asset needs to gain 'only' 5.1x (510%) to rebuild after a -80.5% drawdown. It is a substantial difference.
It's harder to judge the gain in CAGR -- the starting mean value of 133% is colossal already, so the "improvement" to 195% is hard to compare qualitatively. I've included the CAGR numbers just for comparison and for clarity, but it's obvious the future actual observed growth rates of these more popular coins will be much lower.
As stated earlier, the strongest aim of a moving average strategy is reducing the extent of drawdowns, staying out of the asset while a severe downtrends develops. This might be a potentially very useful feature if any sustained and prolonged downturn for all cryptocurrency assets was to develop. On the other hand, the most demanding scenario for such a strategy is a prolonged, lengthy consolidation phase, which usually results in a lot of whipsaw and sub-optimal opening and closing of positions. The strategy makes more sense, the more 'trending' an asset class tends to be (both up- and down-trending).
As always, be advised that constructing a true, real-time trading strategy needs much more work than a simple in-sample backtest. At the most importance is data quality - gathering correct data, the handling of incomplete data, data spikes, and so on. A very important issue of trading costs remains. And at last, the specific portfolio construction and rebalancing scheme is of great importance regarding risk management of such a potential investing strategy. Risk management remains much more important than favorable signal generation or market timing.