Sentiment analysis is one of the investing tools I'm most fond of. There are multiple ways of measuring sentiment: from basic investor surveys to advanced text mining techniques, but one of the most robust and long-term datasets is ifo Institute's business climate sentiment polls.[4]
The data is available from 1991 (Germany's unification), but there is also a dataset available with data from West Germany from 1960 to 1990. I've combined these datasets to form a 60-year index of sentiment among businesses. That's some of the most robust data available - although released monthly, the methodology has been fairly stable through the years.
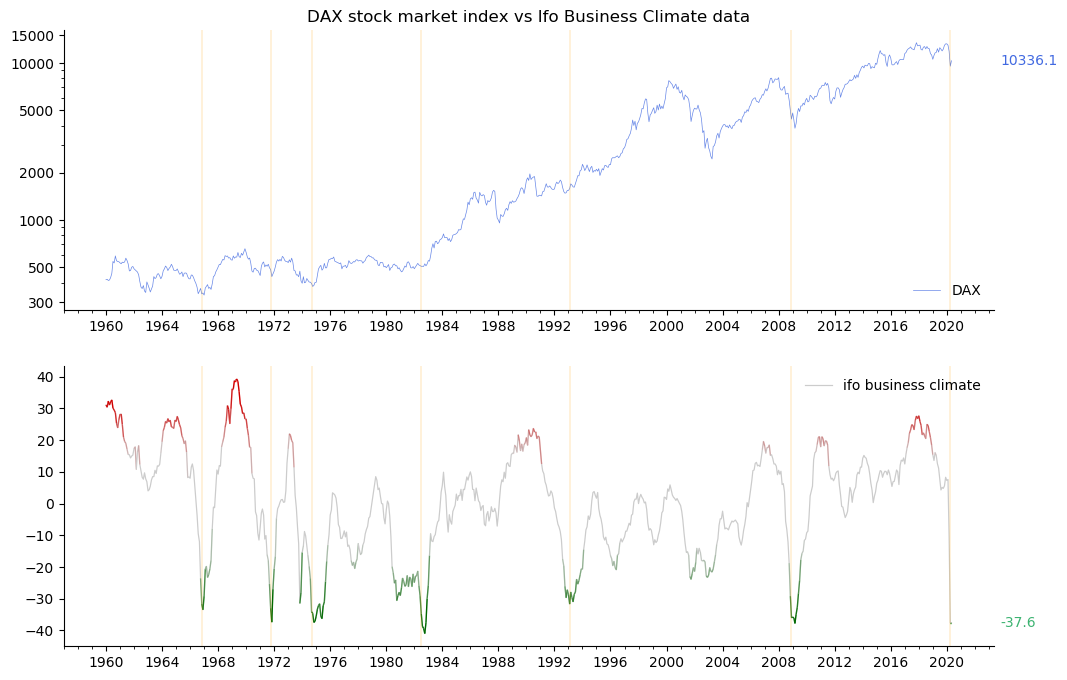
Below is a chart comparing the business climate balances (note: not the formal Business Climate Index that ifo calculates - just the raw differences that comprise the index) to Germany's main stock market index, the DAX. I've added some coloring to articulate extreme negative (green) and extreme positive sentiment (red).
The data is also sliced into 10 bins, to better visualize what happens at the extremes. Below the chart a histogram of these bins is available.
Hover over the bin categories or the ifo business climate chart, to see specific moments on the DAX.
As of time of writing (April 2020), the latest value is -37.6, which is among the lowest in this survey's results. That means that now, in the midst of the coronavirus panic we've just fallen into the 1st bin category, which historically preceded one of the best future returns for the DAX. Similar areas highlighted by dark green.
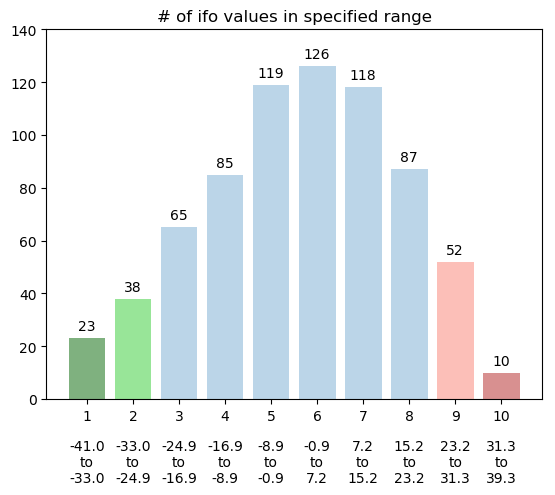
What follows is an analysis of forward returns of the DAX index from periods of 3 months up to 48 months (4 years) following each of the 10 ifo business climate ranges. Note the ranges are not equally sized (so these are not deciles of the dataset), but are equally spaced (each of the ranges is roughly about 8 points in width, that is -41 to -33 for the 1st, -33 to -25 for the 2nd, and so on).
In each of the graphs below, the horizontal axis with points 1 through 10 represents datapoints from the ifo ranges shown above, and the vertical axis shows subsequent returns of the DAX index.
The full blue and black lines represent a median and mean of returns, respectively, from each of the 10 ifo ranges (histogram bins). The dashed horizontal lines are medians and means of all datapoints for that period, irrespective of the ifo range. The number in blue on the vertical axis is the median value (the blue dashed line). Green and red lines represent the outermost positive and negative (respectively) returns for that range.
Put simply: the difference between the full blue lines vs the dashed lines is the average upside / downside from buying during the specified ifo range, for the specified period. The span between the green and red lines is the span between outliers for each category.
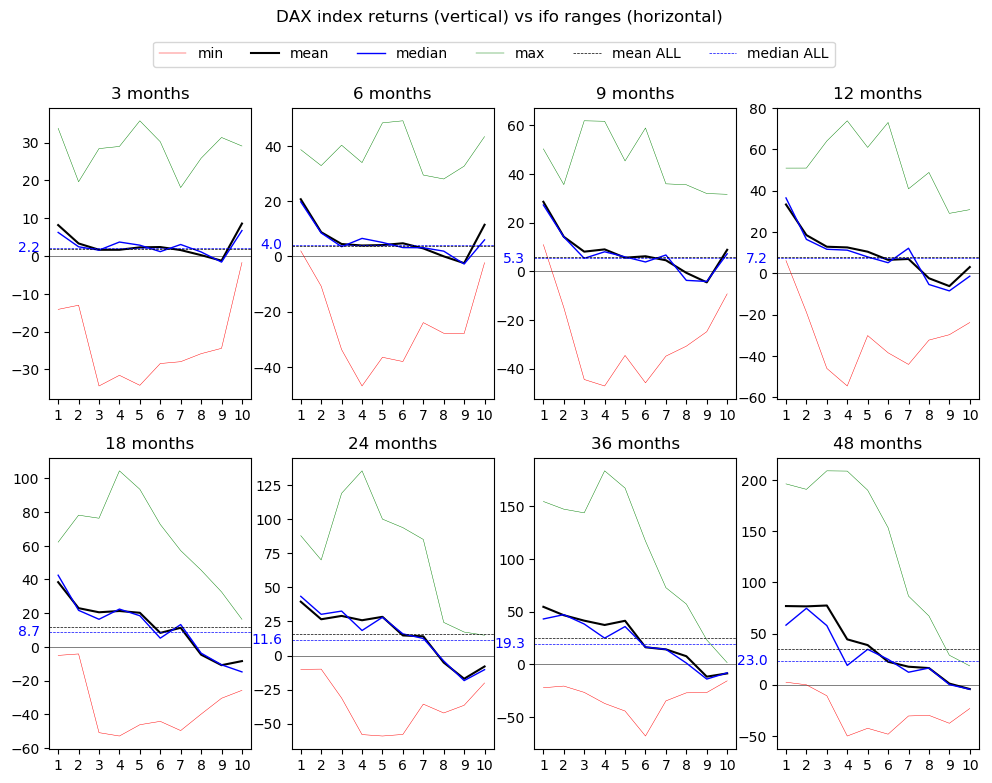
First of all, it is worth noting that the longer the time period, the higher the overall median (blue number on the axis) for all datapoints, irrespective of market sentiments. That simply reflects the fact that stock markets tend to rise in the long run. At least this specific market (DAX index) did.
What is more interesting, is that most black / blue full lines are downward-sloping. This is clearly visible for longer return periods of 9 months and beyond. An investor's median returns are higher when buying during times of low sentiment (low ifo business climate values), than when buying in times of higher sentiment.
Another interesting effect is that in the short run (3, 6 and 9 months), the average returns are better both for buying extremely low sentiment (1st ifo range) and extremely high sentiments (10th range). For the shortest period it was even better to buy "hot" sentiment market episodes. This represents the idea that bull markets running hot tend to stay hot and overreact in the short term, although the return for buying such high sentiments diminishes, the longer the time period considered.
There are no negative returns for buying during 1st ifo range for the period of 6, 9, 12 and 48 months (the red line is above 0). Historically, there hasn't been a loss during these periods. The red line is relatively highest at the 1st range among all time periods, meaning the downside was historically limited.
It should be noted, however, that these returns are among equally weighted datapoints. That means the returns shown here are for "buying each month within the specified ifo business climate range". That is rarely what a typical investor does on the market, usually opening a position once and sticking with it or switching in the following months, instead of opening multiple equally weighted new positions each month. So it's important to remember that these returns are additive in nature, not multiplicative, as is more often encountered in the real world.
Also the ifo ranges are not equally distributed. There are significantly more months of "average sentiments", the ifo range with most datapoints (6th) comprises of 126 months, yet there are only 10 extreme-up and 23 extreme-down sentiment months. One ought to be careful about reading too much into conclusions stemming from such a small sample of returns. Still, it's the longest sample we've got, so let's play along with the analysis.
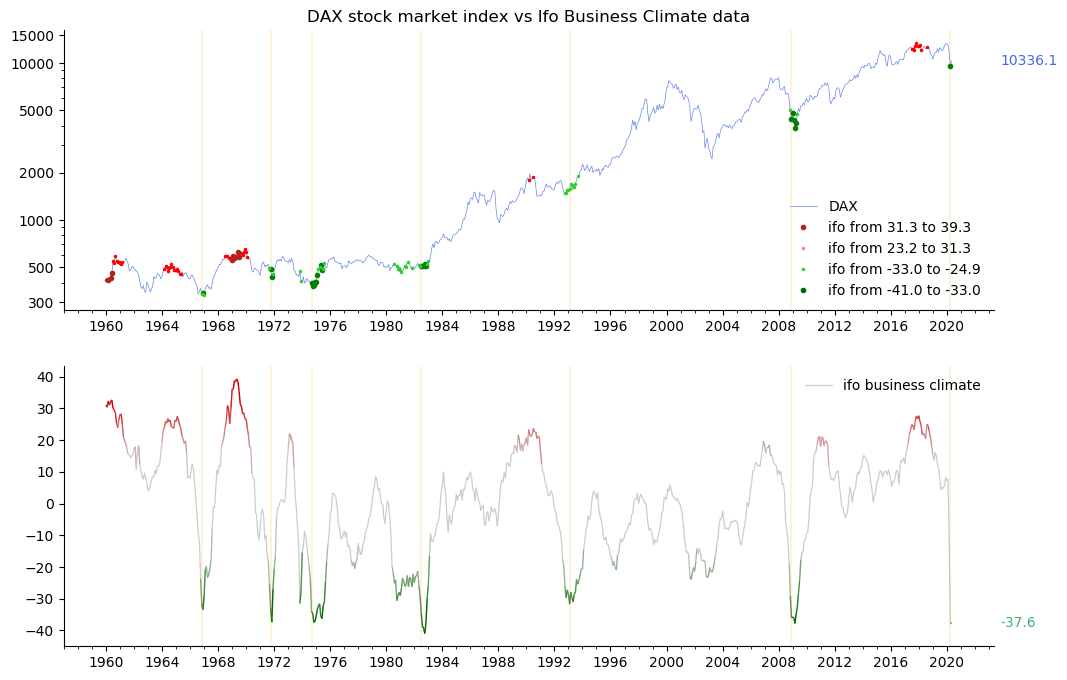
The orange horizontal lines are simply dates when the ifo business climate index crosses a specific value (-31.5) downwards. They're plotted to show particularly good long-term buying opportunities, and it's good to see they align neatly with the green-most (1st range) and lighter green (2nd range) months.
Lastly, the spans between the best and worst returns are pretty big. This represents the fact that even though we focus on the means or medians of returns, the deviations of returns for each range and time period are large. It shows it's good for future returns to buy during times of low sentiments such as the one we're currently experiencing, but it's important to remember there are no risk-free nor drawdown-free returns on the stock market, and even buying during these favorable times might result in losses. Buying during times of low sentiments is a tailwind for future returns, but there are no guarantees.
If you have any other insights or observations regarding this data and analysis, feel free to reach out and chat.
Let's finish off with a chart with the most extreme ifo ranges (1st and 2nd in green, 9th and 10th in red) vs the index:
The data used in this analysis is widely available on the web. There are different ifo business climate index versions available due to adjustments in the methodology (most sources use 2005 or 2015 as a base year for the index calculation), so I've decided to use only raw balances, which are more similar between sources.
It is important to note that the data is seasonally adjusted. It is subject to revisions, so values released for the recent month can and will be adjusted in the future. This warrants caution in applying the raw data in strict algorithmic trading settings without accounting for these revisions.
The specific datasets I've used in the analysis are:
a) ifo business climate for West Germany (1960-1990) and
b) ifo business climate for Germany (1991-2020).