Dual Momentum & Global Growth Cycle Enhanced
Enhancing the classic Dual Momentum strategy with insights from the Global Growth Cycle
Table of contents: Dual Momentum — original, slightly enhanced, Dual Momentum — Global Growth Cycle Enhanced, Summary and Discussion, References
The Dual Momentum approach, formalized in Gary Antonacci's 2012 paper[1] and later popularized in his book,[2] is a surprisingly simple yet potent tactical asset allocation strategy. It builds on the fact that assets experience both absolute [time series] momentum, as well as relative [cross-section] momentum, and utilizes both of these effects in its goal of returning better-than-passive returns.
You can easily experiment with different variations of this approach. One specific variant, named the Global Equities Momentum,[3] focuses on 4 assets: US stocks vs Ex-US stocks on the risk-on side, and Aggregate bonds on the risk-off, with T-bills acting as risk-free return proxy. The model trades once a month, using a simple algorithm logic shown in Dual Momentum — original section below.
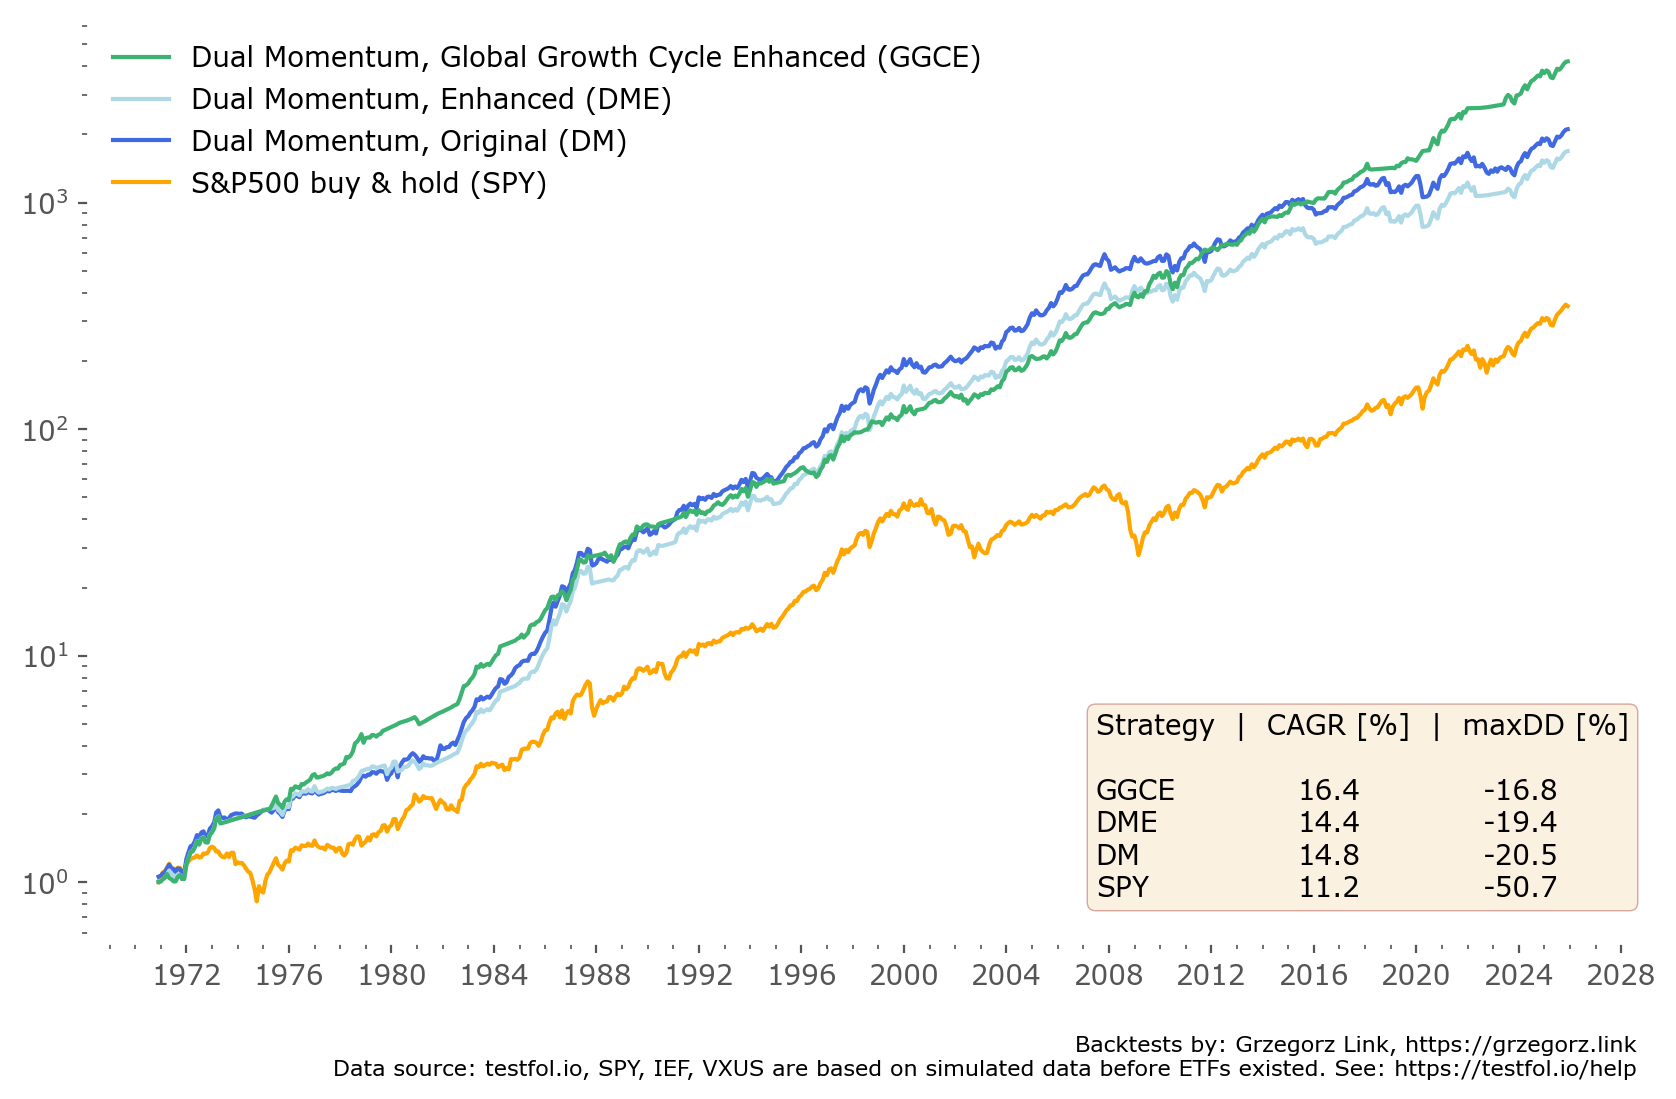
In this article I explore enhancements to this strategy, and how it can be combined with the Global Growth Cycle framework, for achieving better risk-adjusted returns. The results are briefly shown in figure 1. What follows is a more detailed explanation of both methodologies and a quick discussion.
In the era of LLMs writing long introductory articles becomes a bit pointless, as you can easily find most basic to fairly advanced topics easily explained by the chatbots themselves. I do not use automatically generated texts on this website, only my own words. For a more comprehensive explanation and backtests I refer you to the References section below, or to asking a LLM chatbot for assistance.
Dual Momentum — original formulation
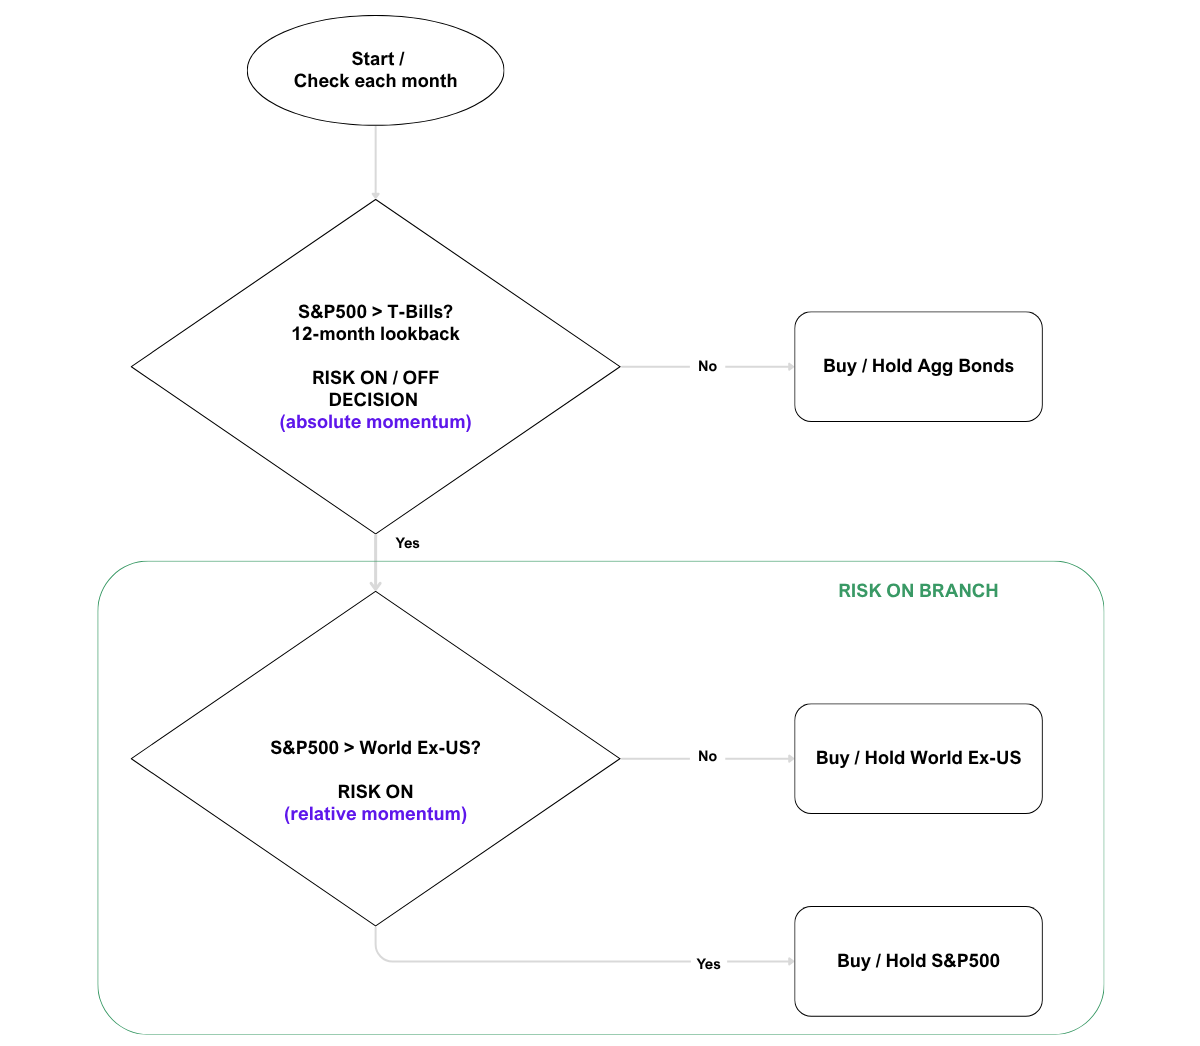
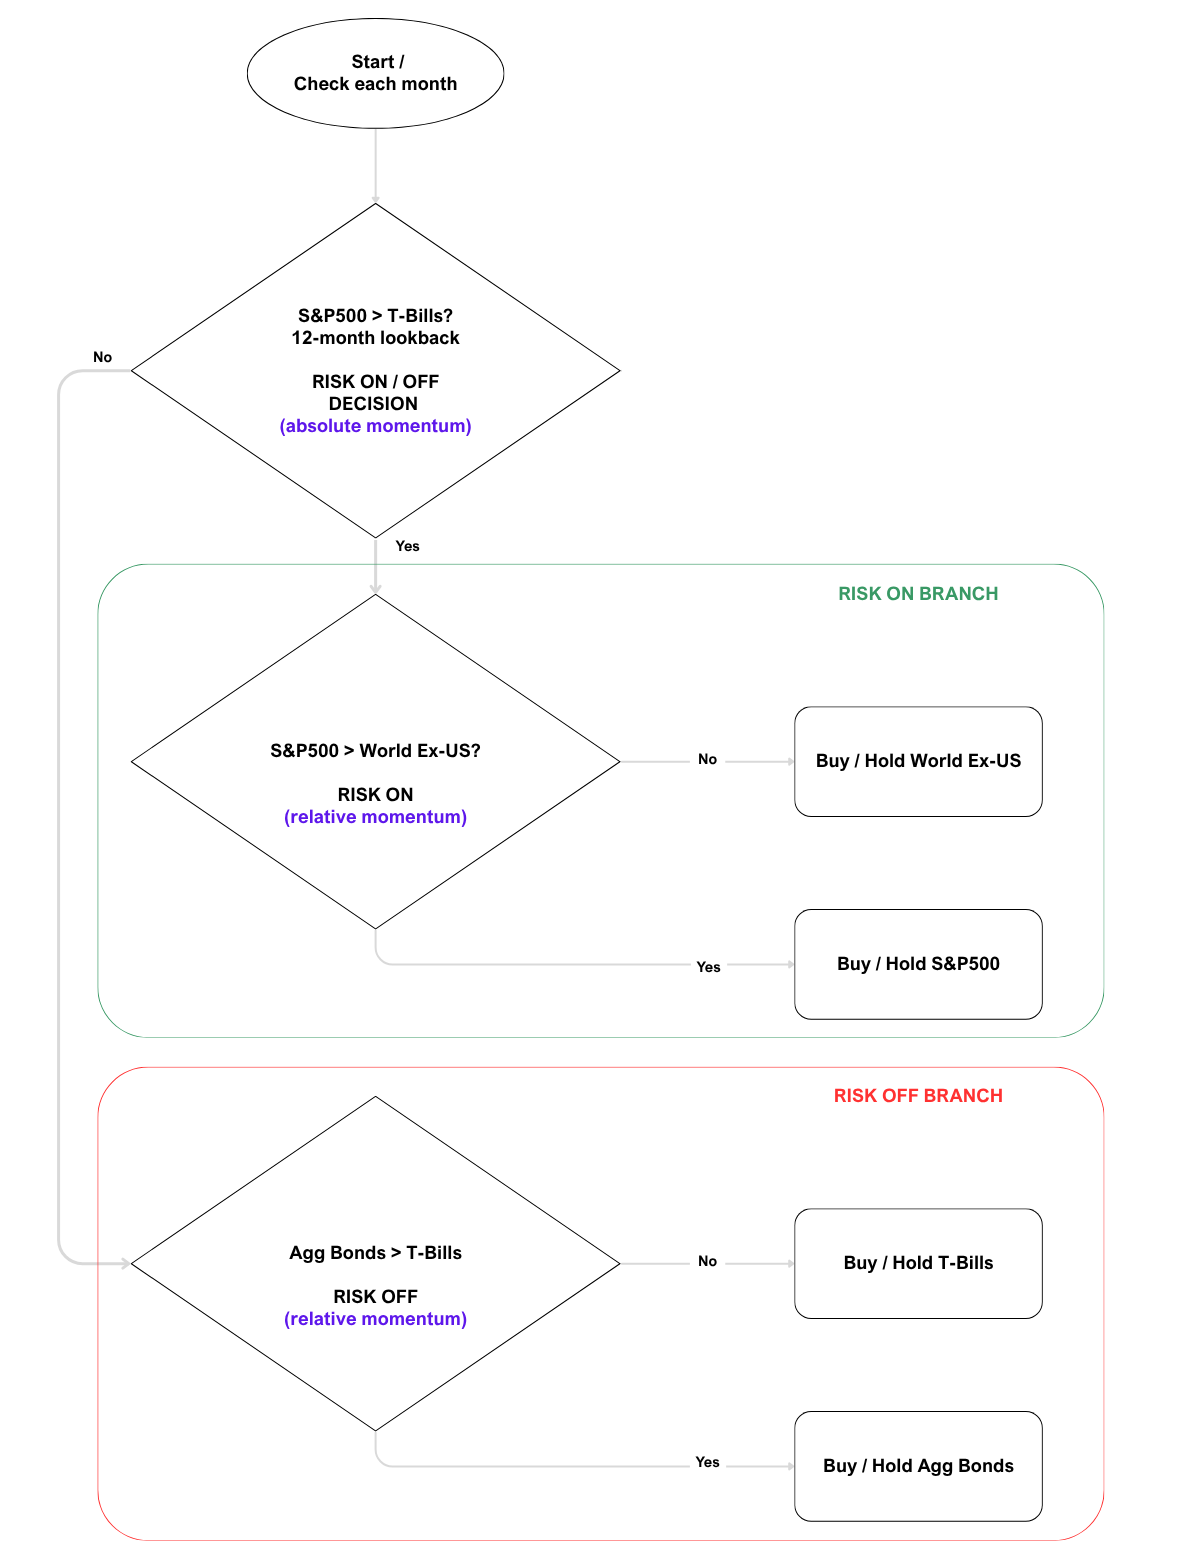
The original formulation starts of with a Decision Block: a Risk-on / Risk-off decision based on the absolute US stocks momentum for a given lookback period (compared to a return of risk-free T-Bills). When the absolute return is low, we turn our full portfolio to Aggregate Bonds (risk-off). When the return is higher than that of short term T-Bills, we move into the risk-on branch, and select between US or non-US stocks. We hold such a portfolio for the full month, until the next decision step. See flowchart on figure 2.
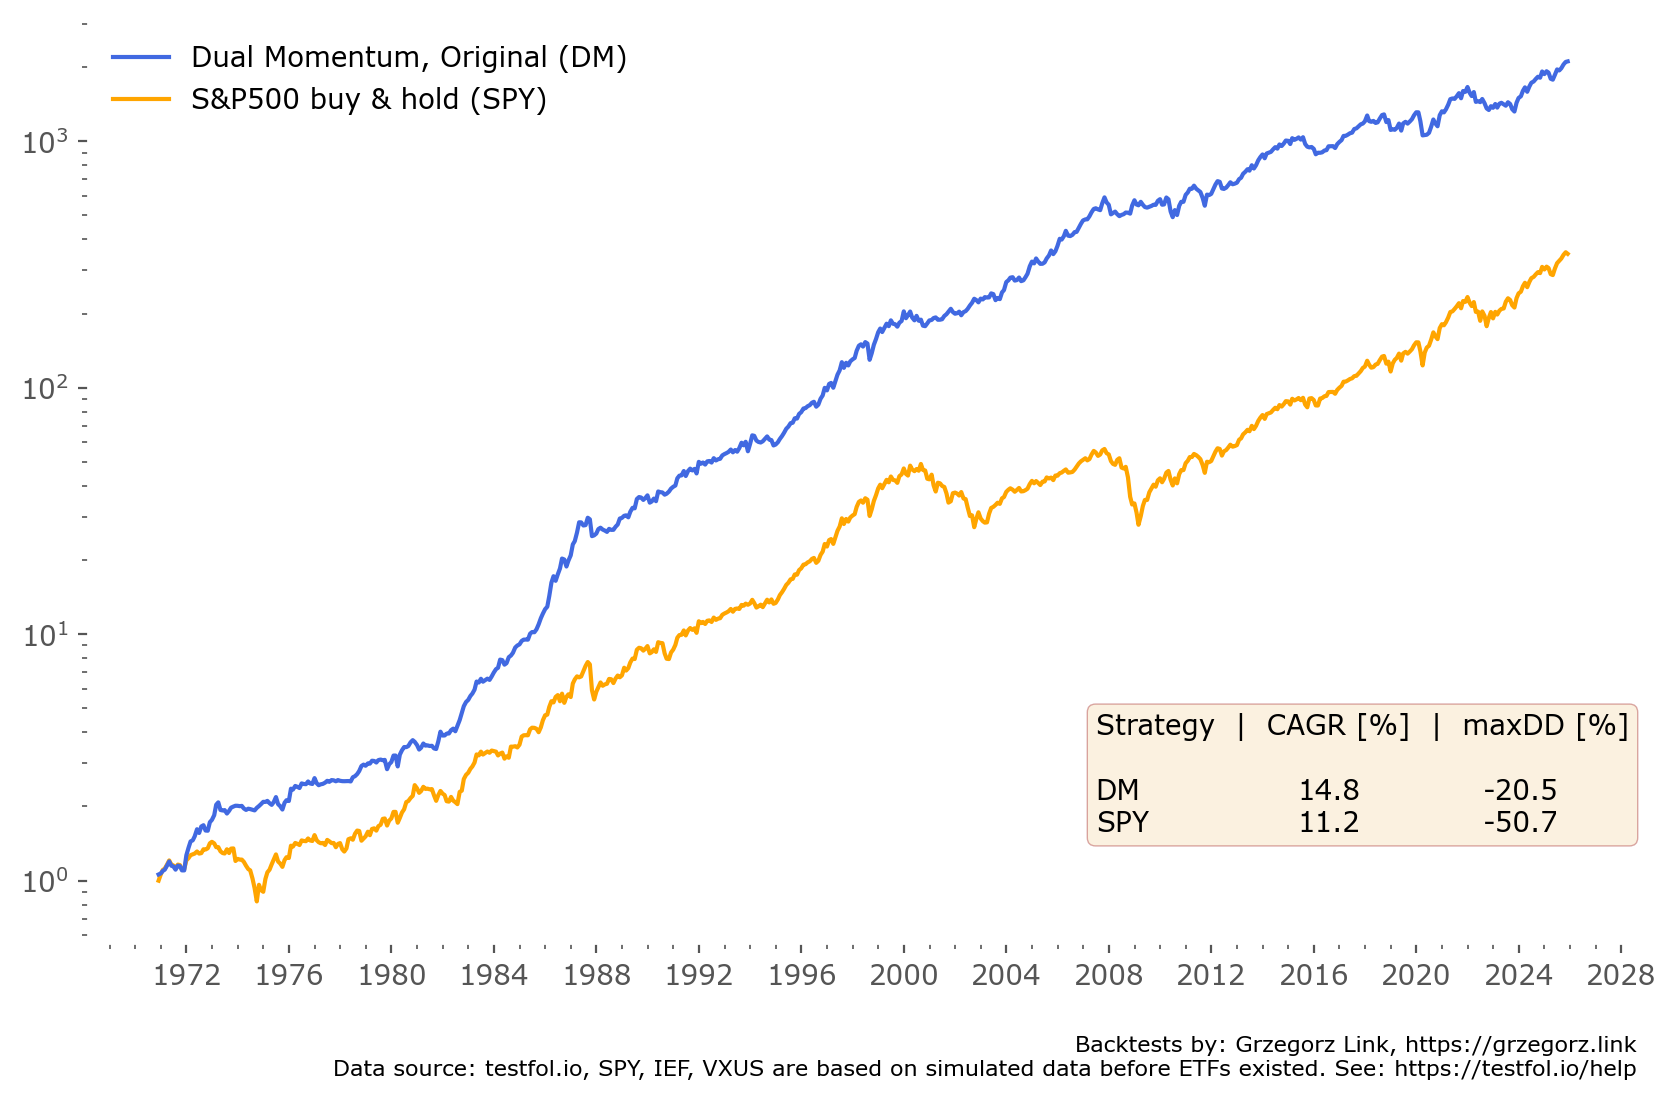
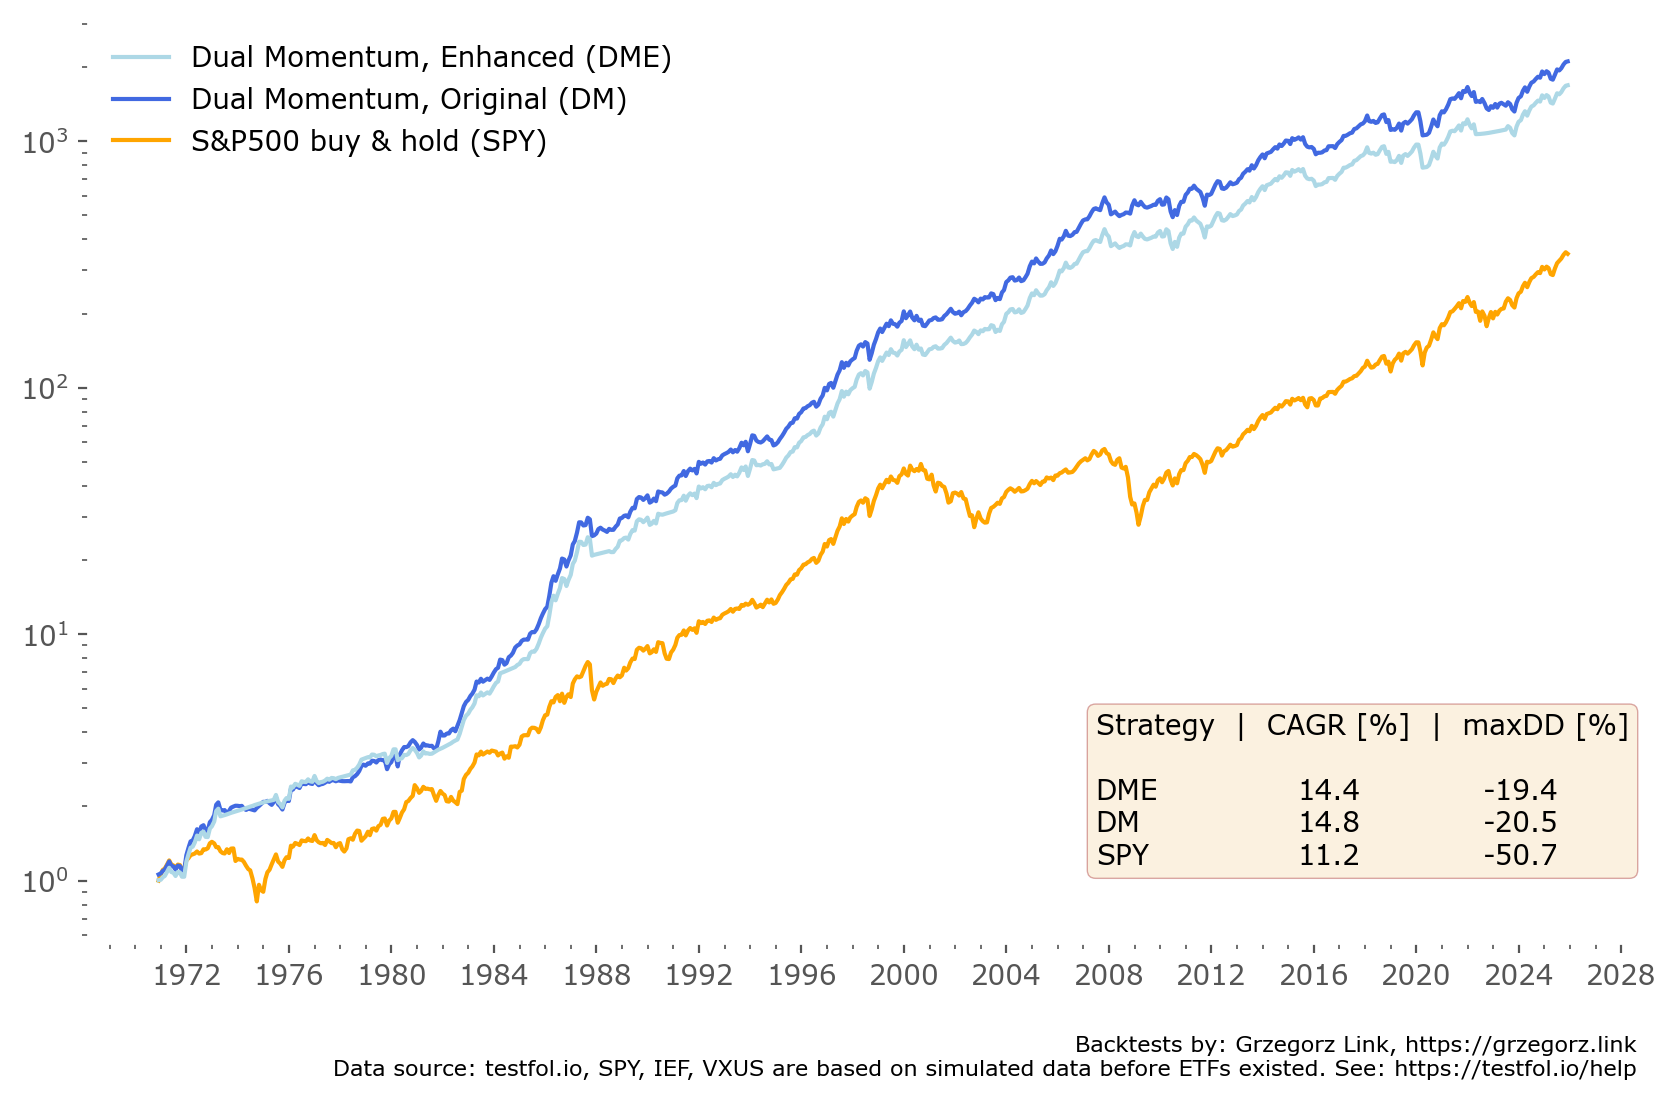
Returns of such a strategy are shown in Figure 3. I've used the ETFs: SPY (S&P500), VXUS (Vanguard Total International Stock), IEF (iShares 7-10 Treasury Bond) and BIL (SPDR Bloomberg 1-3 Month T-Bill) as the building blocks, with backtested simulated data from testfol.io for dates before those ETFs existed. As you can see, both the CAGR and maximum drawdown maxDD (14.8% and -20.5%, respectively) are significantly improved over the bare, buy & hold version (11.2% and -50.1%, respectively). This resonates with other similar backtests of the strategy.[4]
An important note on methodology: in the original, the author uses the aggregate bond index for risk-off, so AGG (iShares Core U.S. Aggregate Bond) would be a better alternative to IEF. Testfol.io does not have a AGG pre-existing proxy, that is why I've settled on IEF. Other sensible alternatives are: TLT (20+ Year Treasury Bond) and SHY (1-3 Year Treasury), which generally lead to similar results, albeit with a slightly different CAGR and maxDD. If you're interested in testing with other bond proxies, I leave this excercise to the reader. For clarity and for simplicity, I will stick to the IEF version throught this article.
I also neglect, throughout these backtests, the transaction costs of each trade. For future use in a realtime strategy setting, such analysis is mandatory. But we can reasonably expect in today's low cost ETF enviroment, that such costs wouldn't be of great concern, especially taking into account the low frequency nature of all strategies mentioned. What would be of concern are tax implications in an unshielded account, due to occasional, strong allocation changes. That is a topic for a different article, but worth to keep in mind.
One can easily see the superiority in this simple strategy — it delivers higher CAGR than that of the buy & hold alternatives, while slashing the maximum drawdown nearly in half. That is a very worthy achievement, especially taking into account the simplicity of the strategy and the low effort (monthly signals) it takes to execute.
The strategy also held up quite well since its formulation in 2012, experiencing some slowdown of returns — as is to be expected of known strategies in a real life setting. Afterall, the backtests are usually better then real results. Data mining and hindsight bias are always a danger than one has to be aware of when backtesting such strategies. It has been underperforming the SPY slightly since then, but with the US stock market constantly beating most other markets and making up an ever greater chunk of the All World stocks contribution, it is to be expected.
One problem with this strategy, settling fully into bonds during its risk-off periods, is that bonds were a great diversifier... until 2022. In the 2022 stock bear market they also struggled, experiencing a bear market of their own, in consequence setting the classical 60/40 stock/bond portfolio for a record drawdown in quite some time. One of the reasons for this have been historically low interest rates. This has been a problem and a danger zone for multiple Tactical Asset Allocation strategies [see: Allocate Smartly article on the subject,[5]].
Of course, using shorter duration versions of the bonds index (IEF, AGG or SHY instead of TLT) mitigates this problem to an extent. But the problem still persists. Their drawdowns are smaller, but the CAGR also suffers as a result. See Table 1 for comparison of original Dual Momentum strategy results between different bond indices.
| Dual Momentum with... | CAGR [%] | maxDD [%] |
|---|---|---|
| TLT | 14.65 | -29.14 |
| IEF | 14.80 | -20.47 |
| SHY | 14.30 | -19.76 |
| BIL | 13.44 | -22.97 |
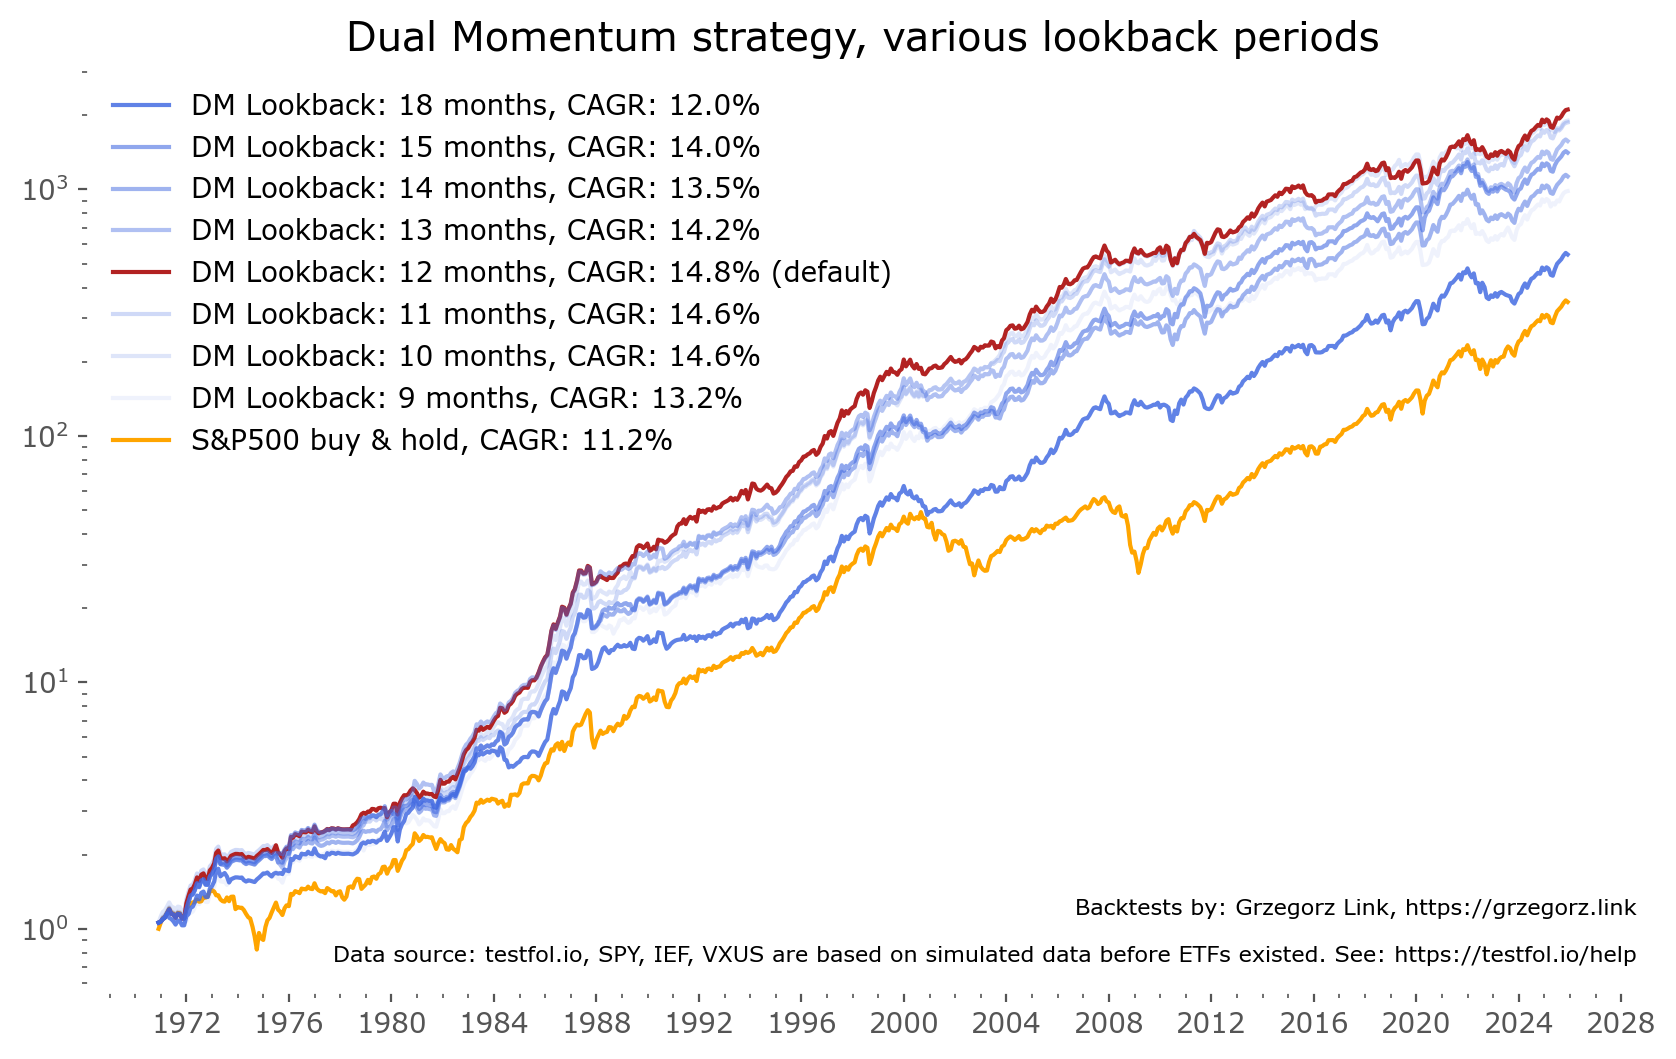
Another area of concern is relying on a Lookback Period of 12 months — which turns out to be a very convenient choice, as some other periods close in time (i.e. 11 months, 13 months, etc.) turn out to yield sometimes quite significantly less CAGR.[6]
The spread varies from 12.0% CAGR to 14.8% for the best, 12-month period version. See figure 4 for charts showing different lookback period equity lines.This is a concern because relying on the best possible version might be overly optimistic. Afterall, we might not ent up in the best of all possible futures. See Corey Hoffstein's take on the topic.[7]
Dual Momentum — enhanced
To mitigate some of these concerns (bonds as risk-off might underachieve), let's first modify the algorithm a little, to improve the risk-off decision making. Let's make it similar to the risk-on case, that is check the relative momentum between BIL and bonds, and invest in the one with higher current values. A modified version of the strategy logic is show in figure 5 below. As you can see, a symmetric red "Risk-off branch" has been added, with a very similar logic to the previous green "Risk-on branch".
Now let's look at the results of this addition in figure 6. As you can see, the total return has gone down — CAGR from 14.8% to 14.4%. But the total drawdown also has, by a full percentage points. That might not be much, but is desireble from a risk-adjusted point of view, but most importantly — addresses the problem of possibe bond drawdowns in the future. In my view the lost CAGR is a small price to pay for this added comfort.
Dual Momentum — Global Growth Cycle Enhanced
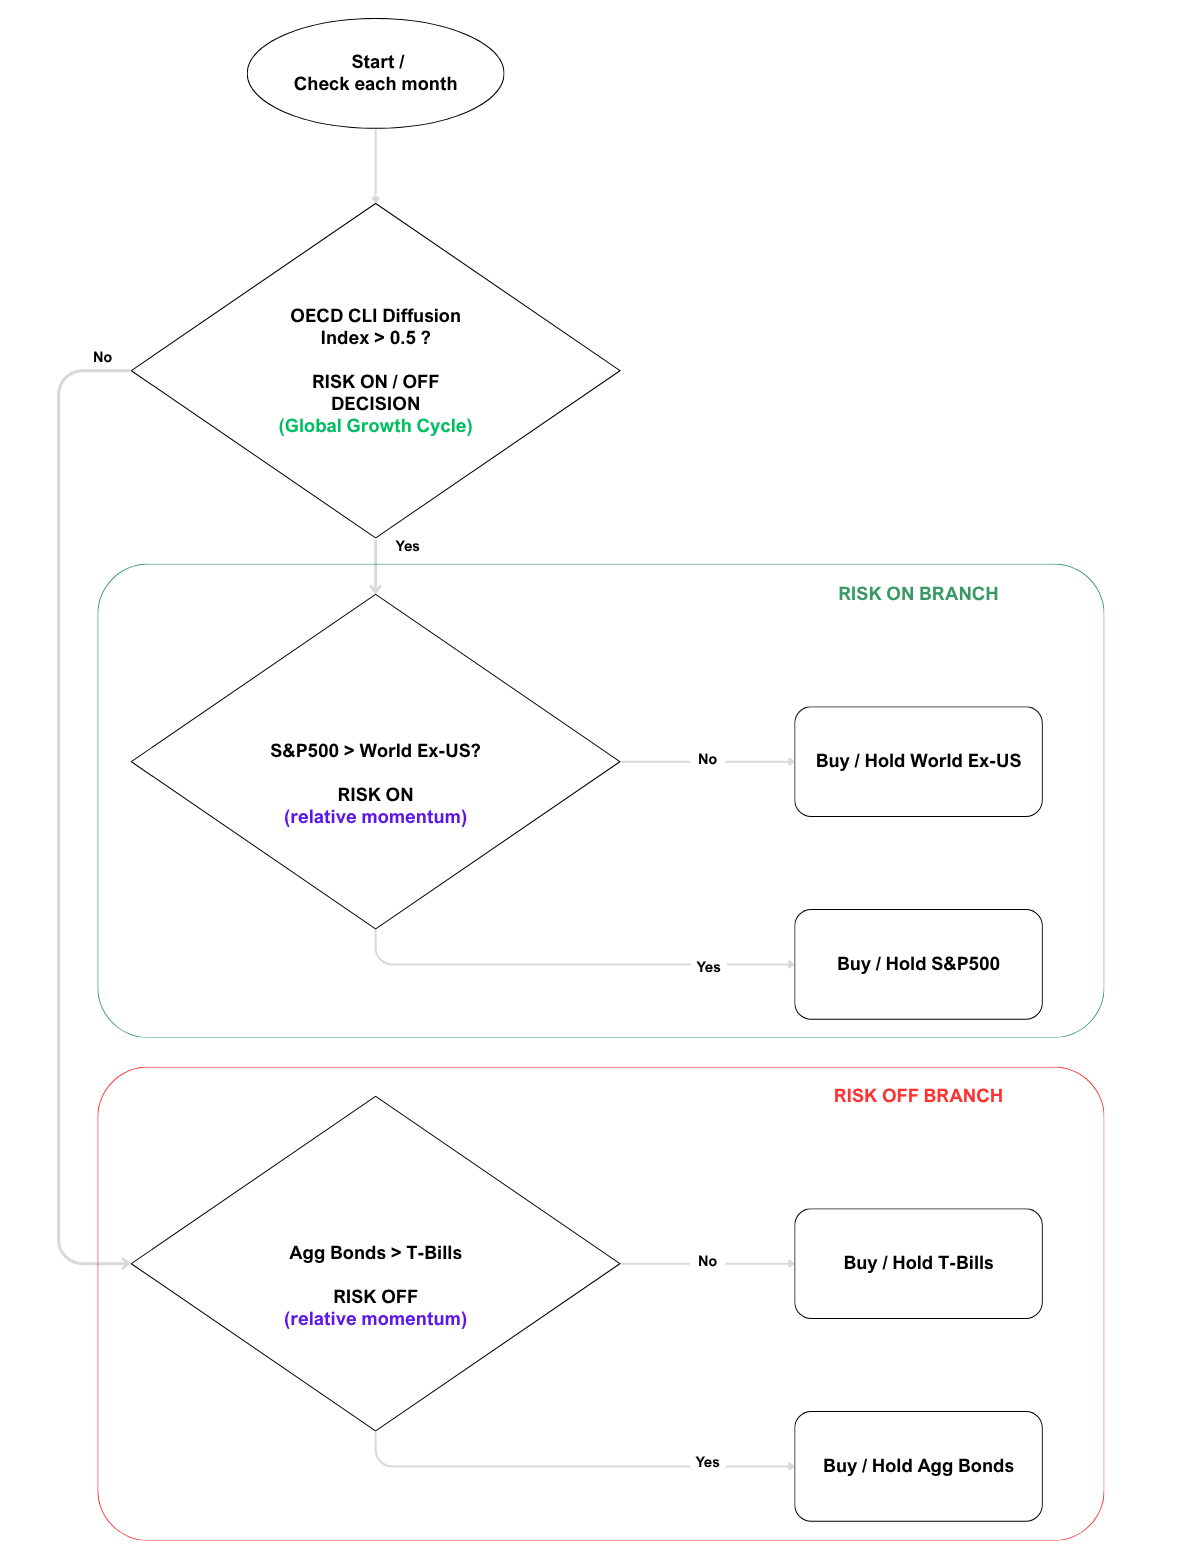
Although the previous enhancement has been fairly minor, I now propose a second, larger hack: substitution of the Risk-on/off selection mechanism completely. I've previously written extensively on the Global Growth Cycle, which is a simple methodology of determining expansion and contraction periods of the global economy. For that it uses OECD CLI data, specifically the Diffusion Index — a metric of how many countries in the database have increasing vs decreasing Composite Leading Indicators. For a full explanation of the model, and the strategy, I refer you to the growth section of this website.
The idea is: what if we could use the OECD CLI Diffusion index to determine risk on/off periods instead? Afterall, previous analysis shows that it might be useful for such a purpose, and has proven itself as great risk-off market timing indicator in realtime data before (the risk-off signal of November 2021).
Figure 7 represents the updated flowchart / decision tree. It is very similar to the Dual Momentum Enhanced version, just with the first decision block susbtituted for the OECD CLI Diffusion Index from the Global Growth Cycle methodology. All else remains the same.
A note on methodology: The OECD CLI data is released in the first half of the month, so I've previously used a shift of 15 days from month start to account for that. Here I just use the previous month Diffusion Index value, so the shift here is even larger than previously. In theory one could use daily data and test the changes in real time, which is out of scope of the current analysis.
Let's have a look how it works in the backtests. Figure 8 shows the previous Dual Momentum versions, along with the new DM GGC Enhanced version. This is the same chart as from the beginning of the article. As you can see — there are some periods of under- and overperformance for the new strategy, but they are generally very similar. The GGCE version worked better in the 1970s and the latest decade, while Dual Momentum original outperformed especially during the 1980s and 1990s. It seems logical — as there have been false global expansion/contraction risk-off signals then in the OECD CLI, while stock market prices was booming up handsomely.
Both the CAGR (16.4%) and the maxDD (-16.8%) are slightly better in the GGC Enhanced version than in the original Dual Momentum formulation. This might be due to greater flexibility to global risk on/off cycles, and the Dual Momentum strategy relying solely on the S&P500 as the main risk on/off indicator. It is true that the US stock market had a phenomenal run in recent decades, but it would be prudent to diversify away some strategy logic from solely the S&P500 stock index.
On the other hand, the OECD CLI Diffusion Index methodology is not without its drawbacks — the main of which is being dependant on an outside institution to calculate a risk on/off indicator crucial for the strategies functioning. Especially since they've been known to change their calculation methodology at least twice — and even fairly recenty. From the perspective of simplicity and data availability, the classic Dual Momentum strategy (or the slightly enhanced version) clearly prevails.
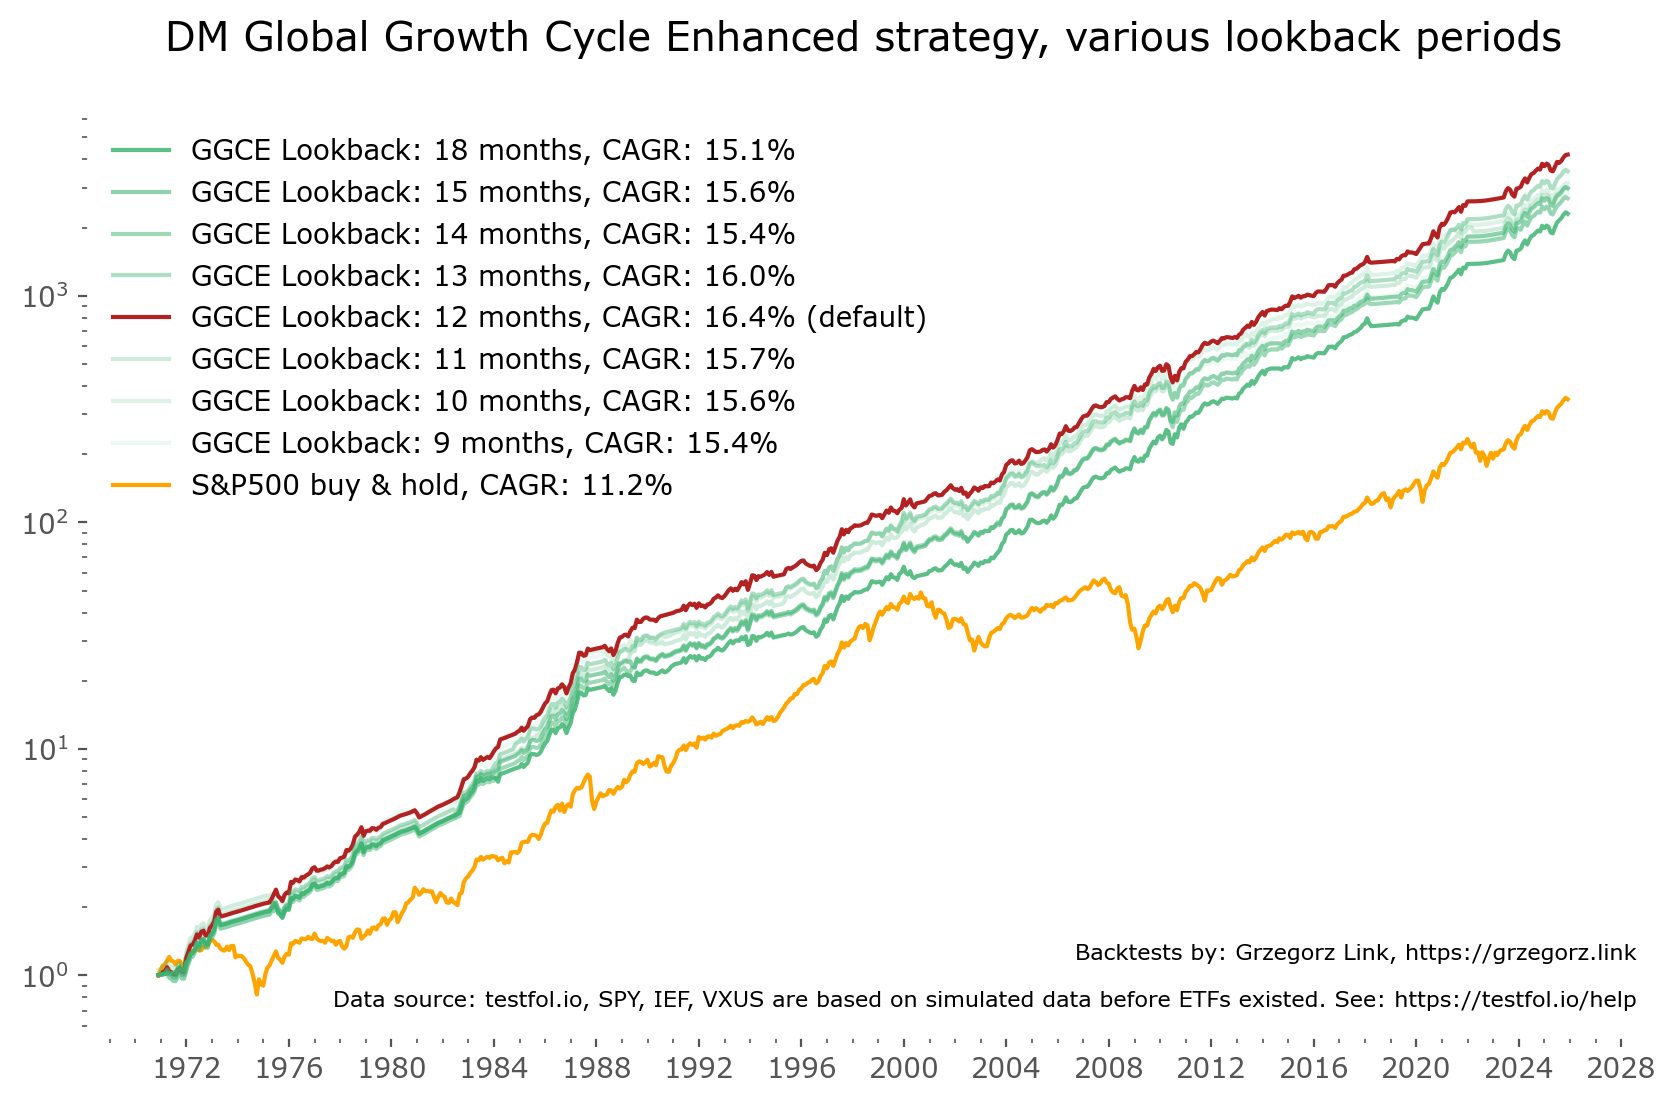
Finally, let's turn our attention to the second DM strategy problem listed above: rather high variability on the lookback window as a source of risk-on/risk-off decision. Does the GGC Enhanced version do better off in this regards? Figure 9 answers this question. As you can see, the variability is still there, spanning from a CAGR of 15.0% to 16.4%. The 12-month is still the best, probably a little over-tested version. So not a total victory on this front, although it is worth of noting that the variability fell from 2.8% in the original formulation to 1.4% in the GGCE version. One can say that half of the variability in different lookback returns came from the risk on/off mechanism, the other half from relative momentum (stock market switching between US and non-US stocks) timing.
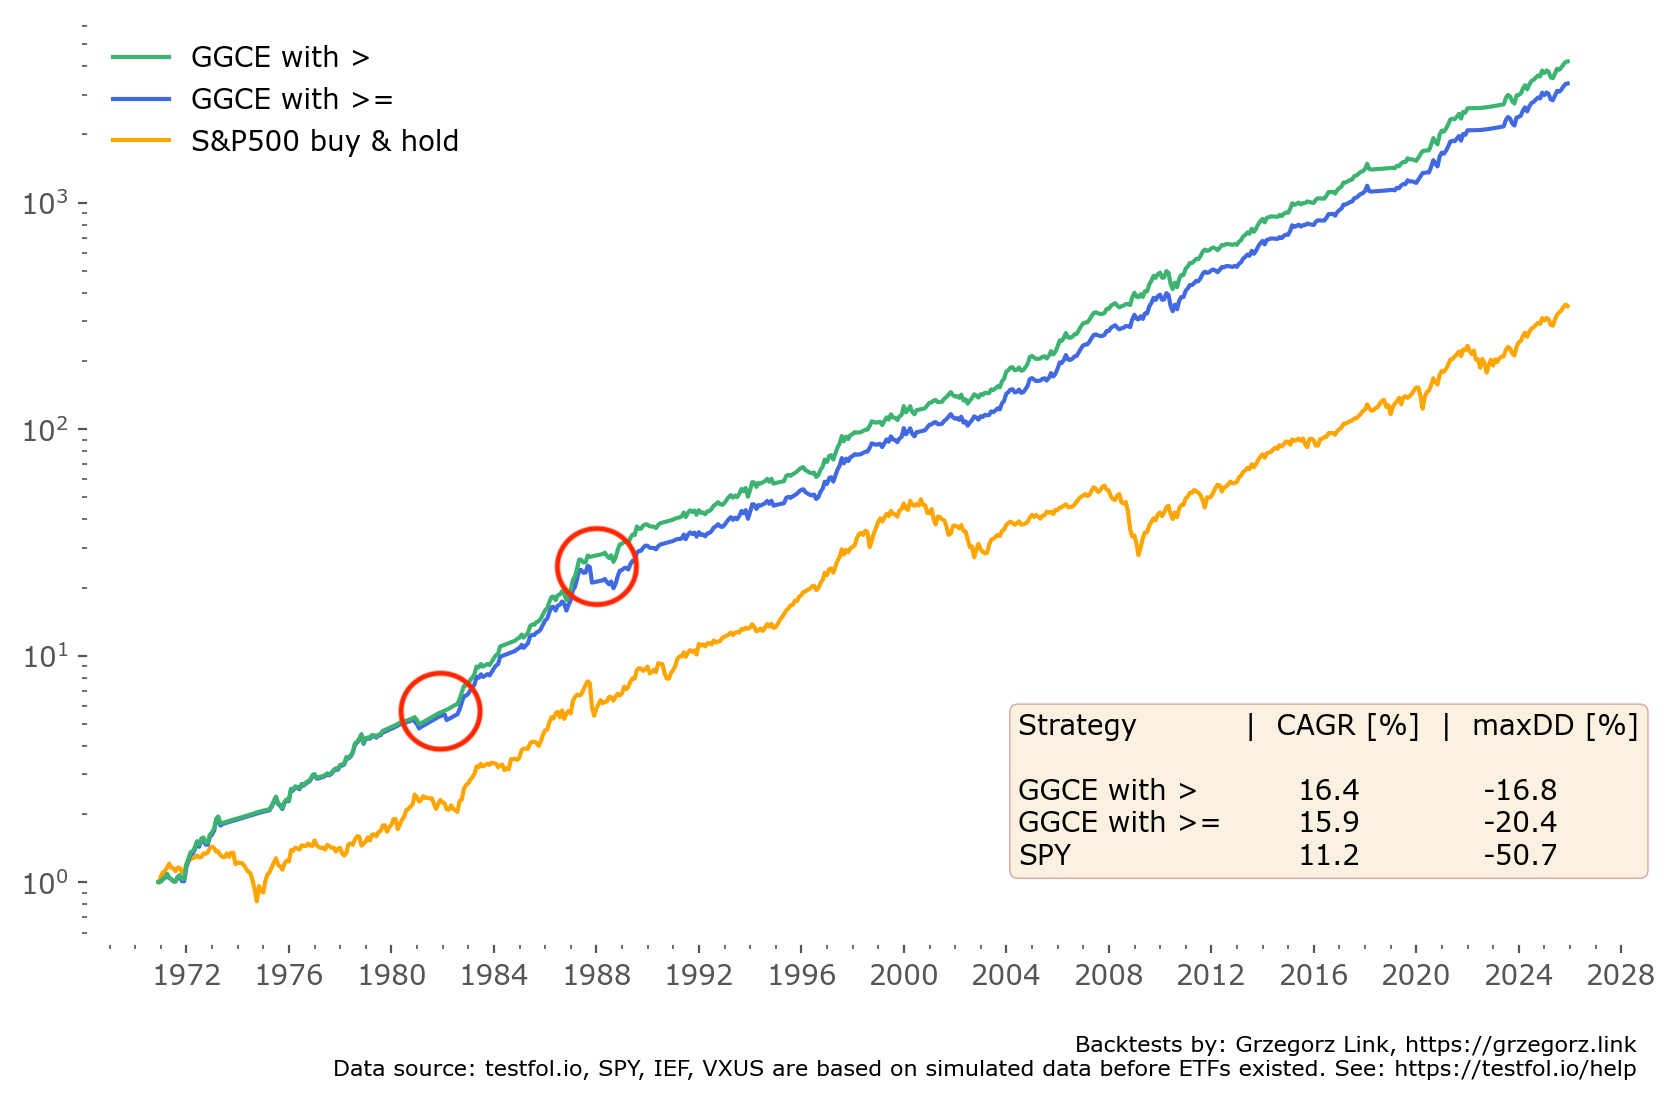
One last word of caution — this part is updated as of , with many thanks to Walter Jones from AllocateSmartly. An important distinction arises when we consider the Diffusion Index being striclty greater than (> 0.5) versus greater than or equal to (≥ 0.5).
Figure 10 below highlights the difference. As you can see changing from > to ≥ introduces two especially inconvenient instances, highlighted in red: (shifted to September to account for data lag) and (shifted to January 1982). The first of these is particularly important for the maximum drawdown outcome — including or excluding this difference results in a maxDD of -20.4% vs maxDD of -16.8%. This is astrong example of how a small change in parameters can significantly influence a strategy over long time periods.
On a positive note, this discrepancy affects historical results, but has no practical impact on current or near-future signals. In recent years there is an odd (as in: non-even) number of countries in the OECD CLI Diffusion Index (39 until 2022, 17 ever since). Because of this, it is currently impossible for the index to land exactly on a value of 0.5, meaning both versions (> and ≥) behave identically. Still, it is important to keep this distinction in mind for future applications — especially if a future revision of the OECD CLI methodology results in an even number of countries being included.
The last time my database shows a Diffusion Index value of exactly 0.5 is . Since then, both variants of the strategy yield identical results.
Summary and Discussion
I've introduced the Dual Momentum — Global Growth Cycle Enhanced tactical asset allocation strategy, which substitutes some of the mechanisms of the original Dual Momentum. First, I've enhanced the risk-off branch by introducing a relative momentum switching mechanism (similar as the risk-on branch uses), secondly I've replaced the risk-on/off decision block with the Global Growth Cycle logic.
The modification addresses some drawbacks of the original DM GEM strategy — namely, higher caution in choosing bonds as a full risk-off allocation, higher variability of returns for different lookbacks, and a small depreciation of backtested results in recent years.
The results are encouraging. The CAGR went up from 14.8% to 16.4%, the maxDD went down from -20.5% to -16.8%. The risk adjusted MAR ratio has risen from 0.72 to 0.98 — both phenomenally high values. Keep in mind — this is only a backtest. As the saying goes: nobody has ever seen a bad backtest.
But the success here brings to mind another question - can the GGC framework be used to enhance other Tactical Asset Allocation strategies as well?
There is an area of concern however — for both strategies, the "default" lookback window of 12-months is conveniently the best lookback period available. This should be a sign of caution. In real life applications, a diversification of lookback periods and execution times (throughout the month) should be excercised.
Another caveat to keep in mind is that the OECD CLI calculation methodology has a long history, but has been known to change throughout the years — at least twice, one of which was a decrease in number of countries included, done fairly recently, in 2022. See GGC Update for more info. Also, keep in mind if you are using > (greater than) or ≥ (greater or equal to) 0.5 of the Diffusion Index — it does not matter for current applications of the strategy, but it might for future ones if the total number of countries available for the DI calculation switches to an even number.
The Dual Momentum strategy still has the upper side of simplicity — you don't need any additional data than price data to make it work. You do need the OECD CLI calculations in the Global Growth Cycle.
Both strategies are composed of a simple logic decision tree, both checked and executed once per month. The trading costs have been neglected in these study. The tax implications ought to be analyzed separately.
Keep in mind, this is just a simple toy model realization of a Dual Momentum strategy, which has countless possibilities to examine. For example, substituting International Equities for Emerging Market economies comes to mind. Or adding a larger set of smaller stock markets to choose from. One can also venture into market sectors. The possibilites are there, and I encourage the reader to make your own tests, on independent data, and always be sceptical of any strategy backtests. Also bear in mind that "just a 20%" or "just a 30%" drawdown in a real life setting, spanning multiple months or even years, feels much, much different than on a spreadsheet. Real investing is much more than just a backtest.
I look forward to independent tests of this strategy and can assist in any questions you may have regarding the specific parameters — don't hesitate to contact me in case of any questions.